Chatbot Analytics
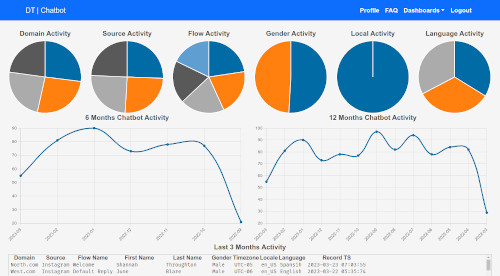
I have made your chatbot activity actionable. Understand everything from how productive your marketing campaign is to your users' demographics. Accessible via PC or mobile phone, you are always connected to your data. Request ServiceEfficiency
Every question your chatbot answers are one less for your team to waste time on. Maximize the time for your team to drive sales.
Experience
Enhance
Compatibility

Which chatbot service provider are you using?
Yes, it’s compatible!
Is your chatbot service provider not listed above? No worries, it will be compatible if it can send an API (Application Programming Interface). Have you heard of the Internet of Things (IoT)? This is how applications can securely communicate with each other.
Chatbot Dashboard
Chatbot Dashboard

Performance
Demographics
Details
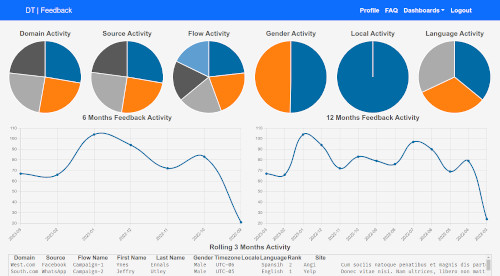
Feedback Dashboard

Feedback Dashboard
Performance
Demographics
Details
Plans and Pricing
Starter
- Chatbot Activity
- Feedback Activity
- Unlimited API
- 8 Visual Graphs
- Real-time Data
- No Yearly Fees
- Custom Flows
- Custom Graphs
Lifetime
Limited Time- Chatbot Activity
- Feedback Activity
- Unlimited API
- 8 Visual Graphs
- Real-time Data
- No Yearly Fees
- Custom Flows
- Custom Graphs
Custom
- Chatbot Activity
- Feedback Activity
- Unlimited API
- 8 Visual Graphs
- Real-time Data
- No Yearly Fees
- Custom Flows
- Custom Graphs
Satisfaction Guaranteed
24/7 Support
Having 24/7 support is important when you are working on a project and need results fast. Our 24/7 chatbot is available to assist you when you need it. If the chatbot is not able to answer your question, there is a way to talk with a human.
30-Day Guarantee
If you are not satisfied with your service, let me know so I can correct it. If you would like to end your first month of service, I will credit it back to you. All I ask is that you let me know why your needs were not met. Contact me for details and I will take care of your situation.


